The Overview tab gives you a snapshot of a profile’s performance at a glance.
Profile header
At the top of the page you’ll see:
- Followers — Total number of followers
- Likes — Total likes across all videos
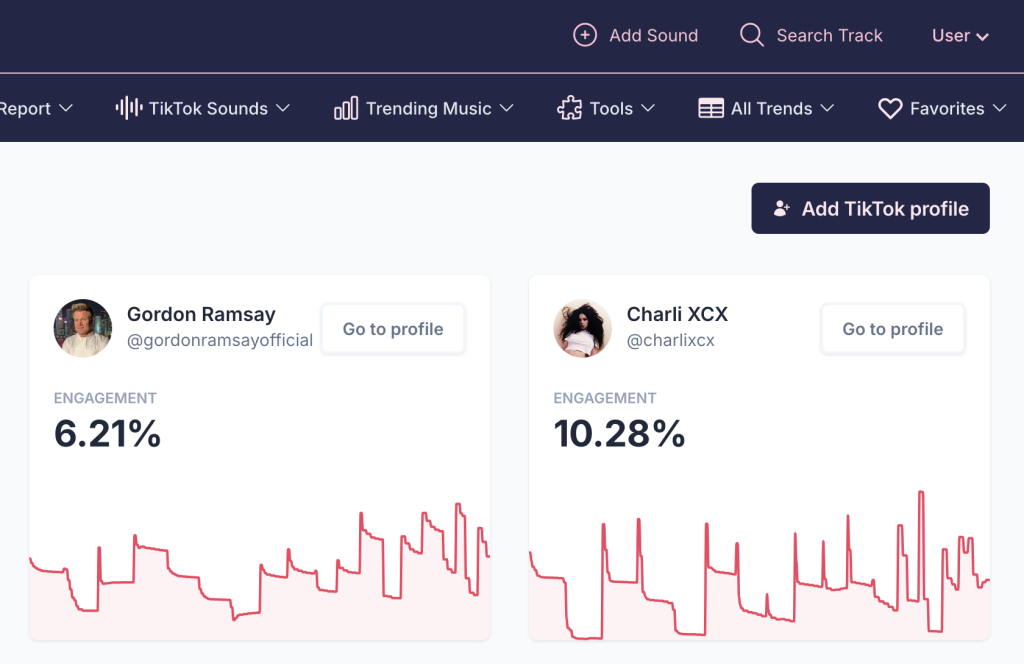
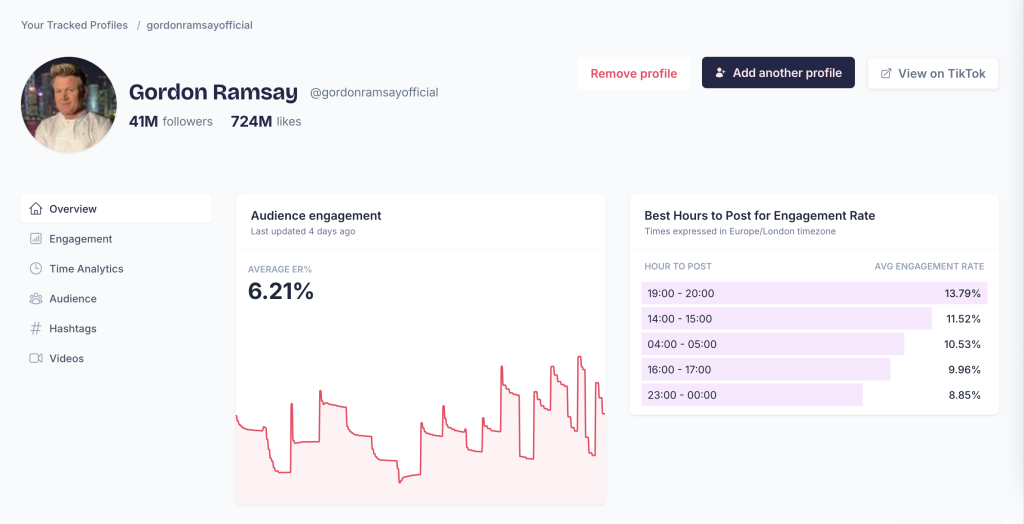
Audience engagement
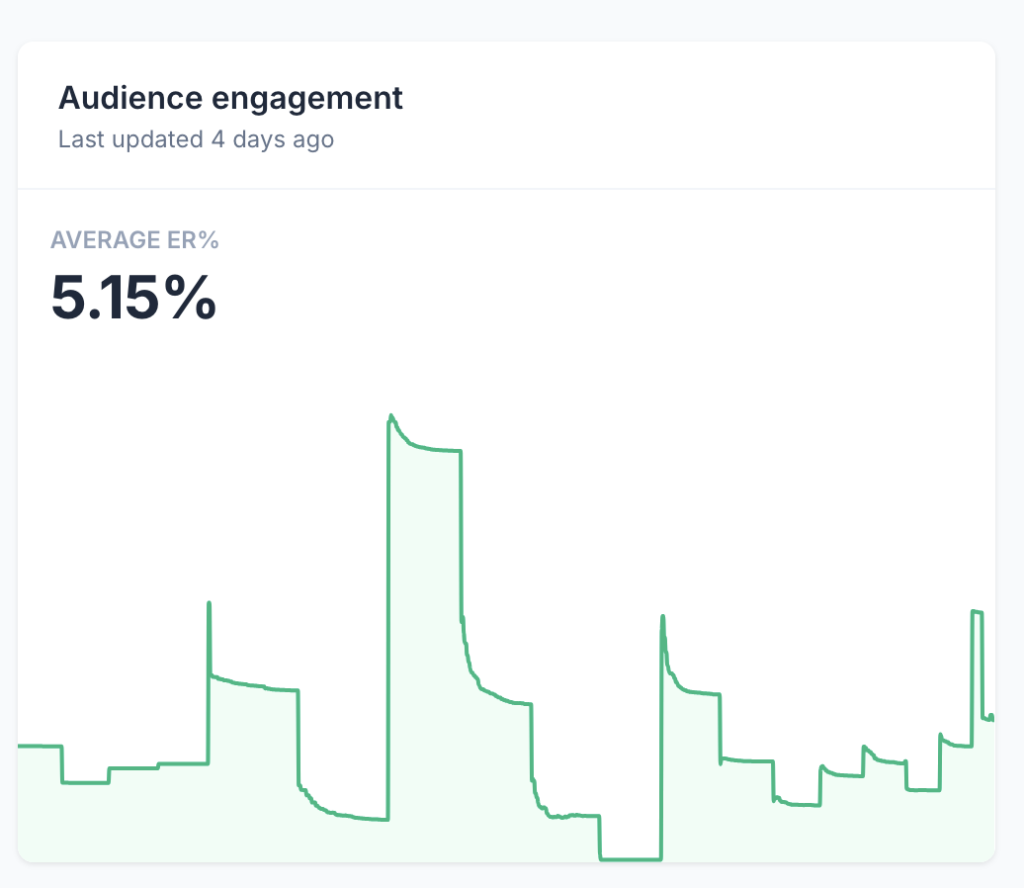
The Average ER% (engagement rate) shows how much interaction a profile’s videos receive relative to their follower count. A higher percentage means the audience is more engaged.
The chart below shows engagement over time, so you can spot trends.
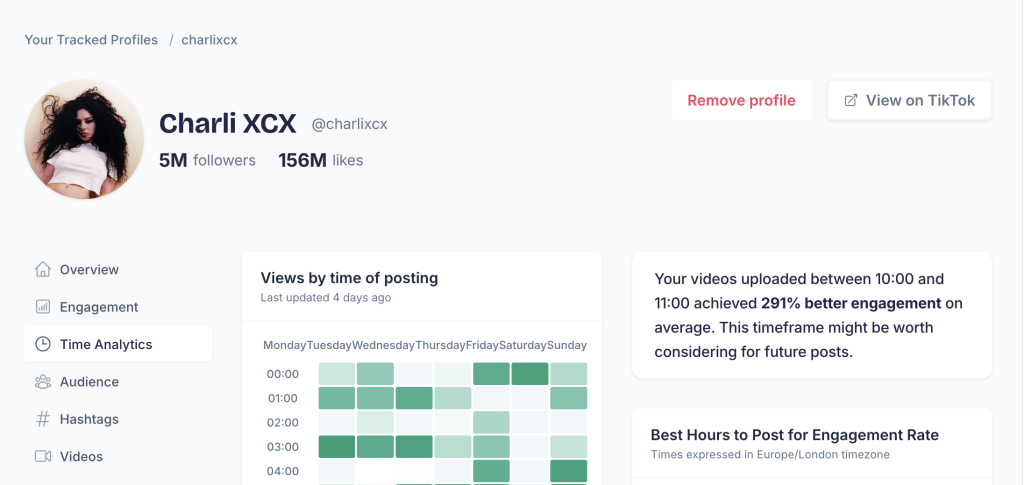
Best hours to post
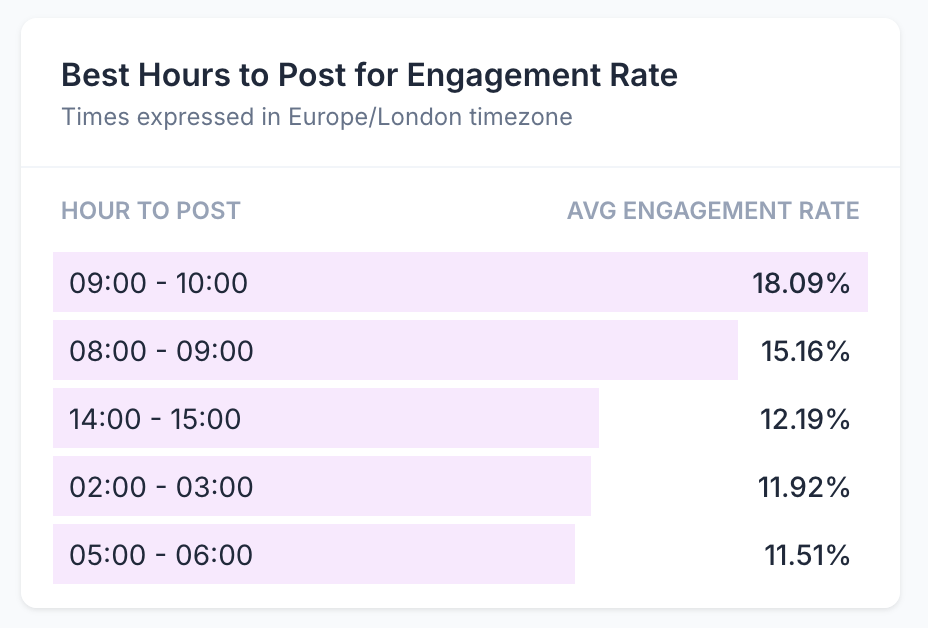
This section shows the hours when this profile’s videos have historically performed best. Times are displayed in your selected timezone. Use this to schedule posts when the audience is most active.
Video metrics
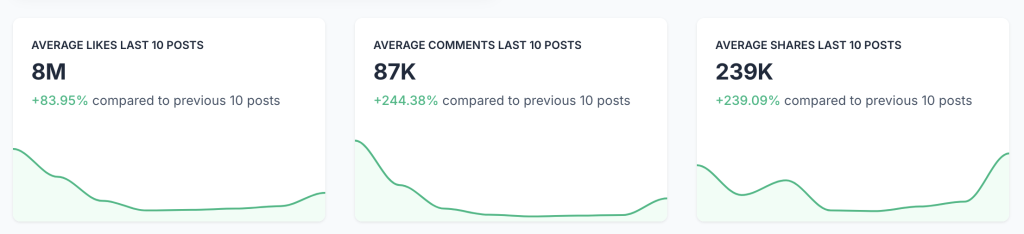
Three cards show average performance for the last 10 posts:
- Likes
- Comments
- Shares
Each card also shows a percentage change compared to the previous 10 posts, so you can see if engagement is improving or declining.
These stats are also available in the Engagement section, where you can also find more detailed metrics like Whatsapp Shares and Saves.
Video views
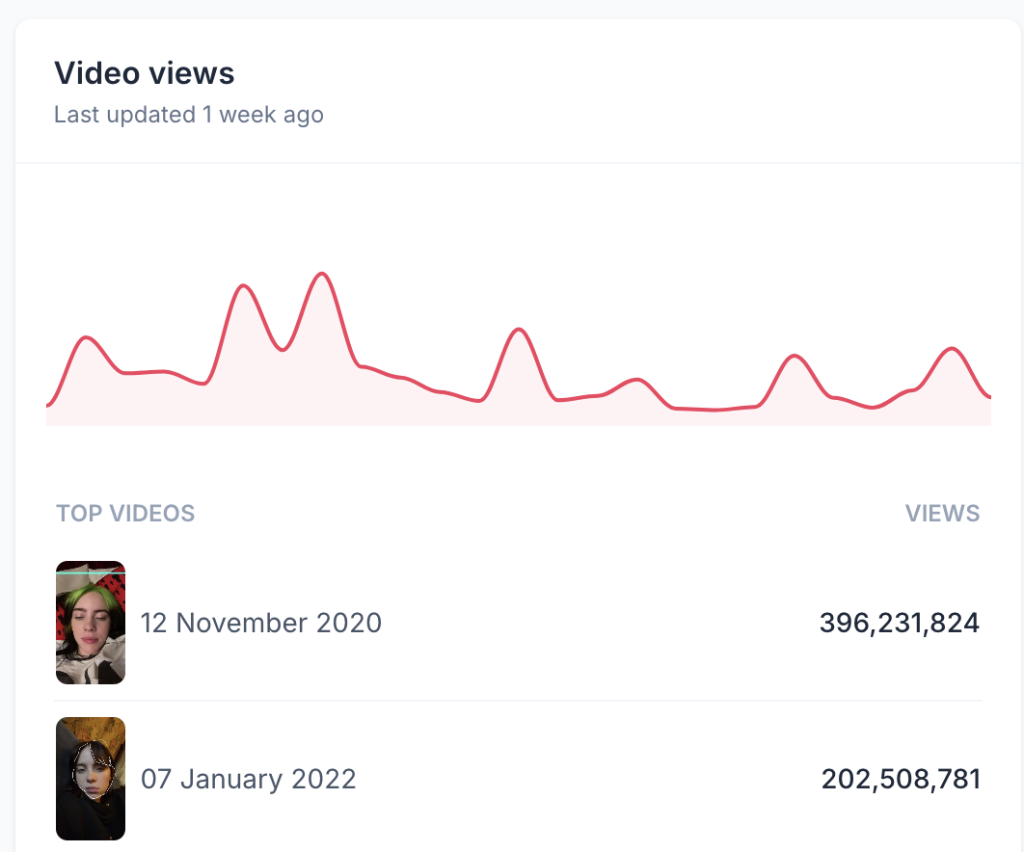
A chart showing view trends over time, plus a table of the top-performing videos by views.
Audience by Country
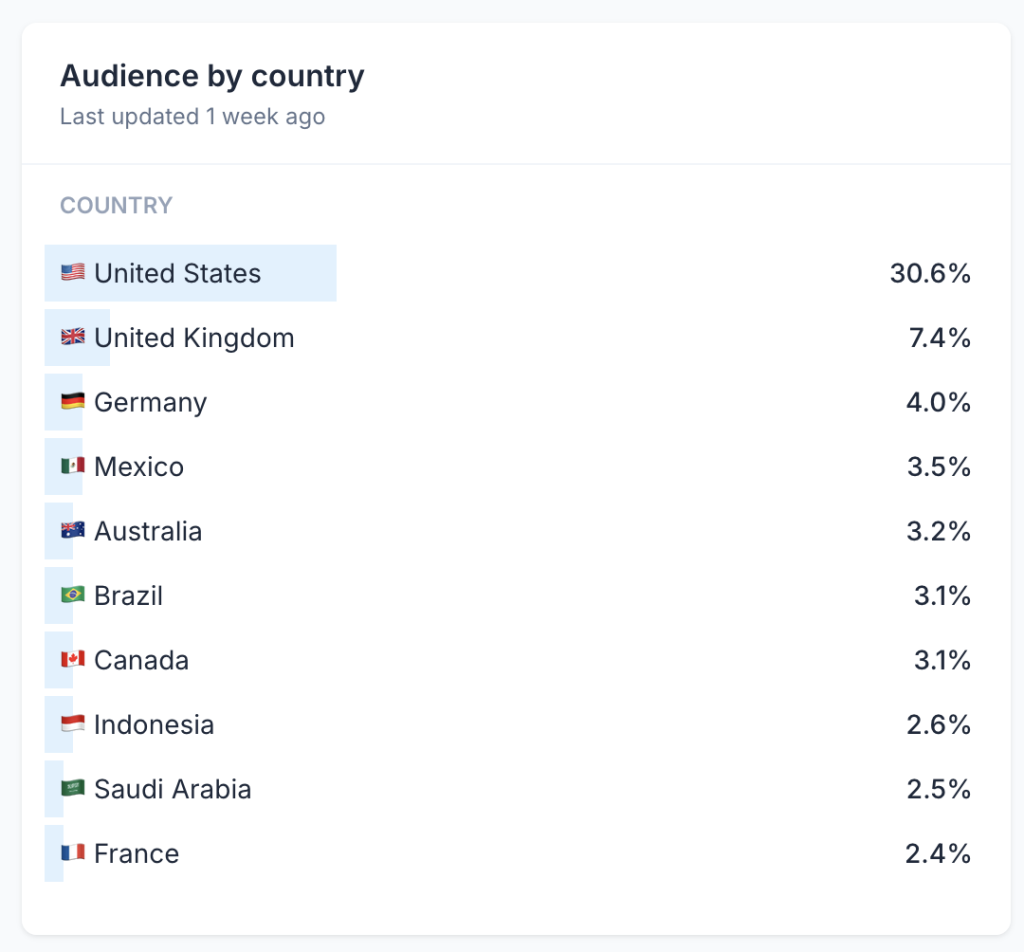
A table displaying where your audience comes from. This data is based on comments on your videos.
Best hashtags
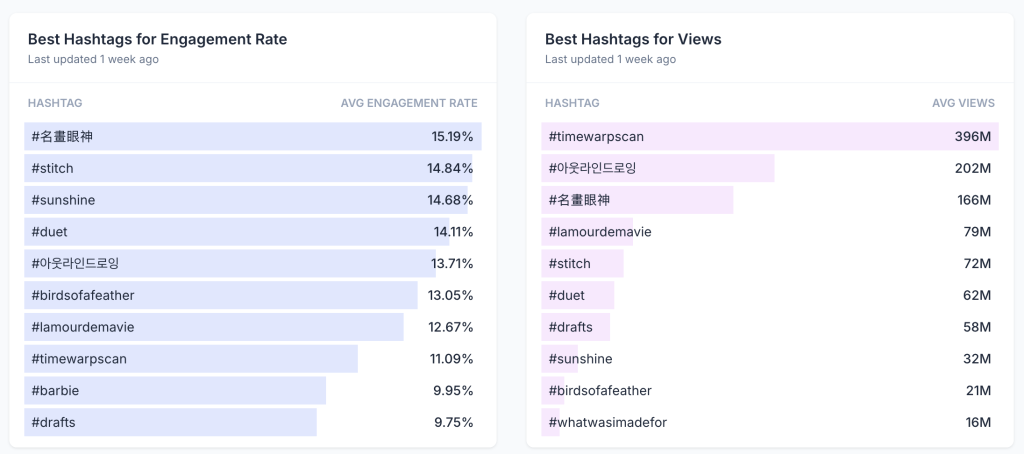
Two lists show which hashtags have worked best for this profile:
- Best Hashtags for Engagement Rate — Hashtags that generate the most interaction
- Best Hashtags for Views — Hashtags that drive the most views
Latest videos and top videos
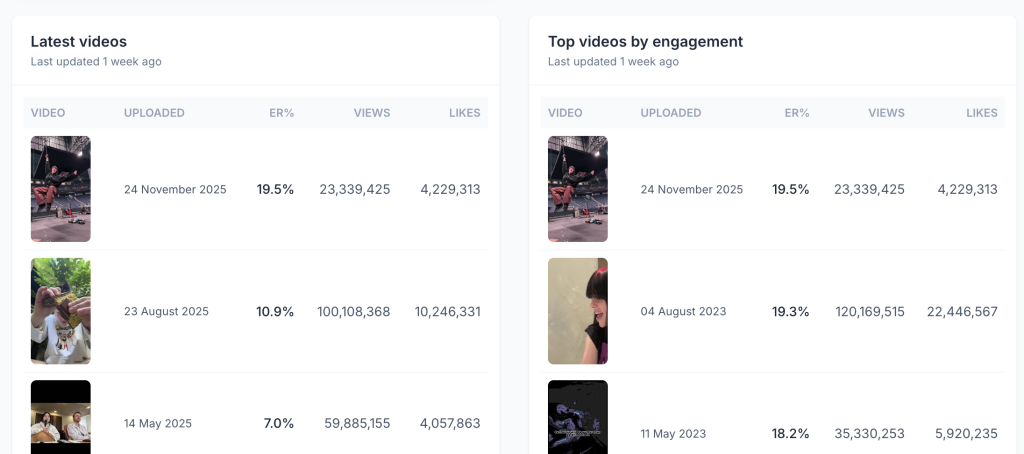
At the bottom, you’ll find the profile’s most recent videos and their top-performing videos by engagement.